Let’s dive into the Pasadena Housing stats for April 2021. The number of Pasadena sales was eighty-seven. Fifty-two of these homes sold over asking, five at asking, and thirty under their asking price.
Last month, just eleven homes last month had price reductions.
The lowest-priced sale was a two-bedroom, one-bathroom, 1,036-square-foot home located at 1708 Lincoln Ave. It sold for $601,000. The most expensive home sold was a six-bedroom, six-bathroom, 6,301-square-foot estate located at 1485 Lomita Dr., which sold for $6,818,000.
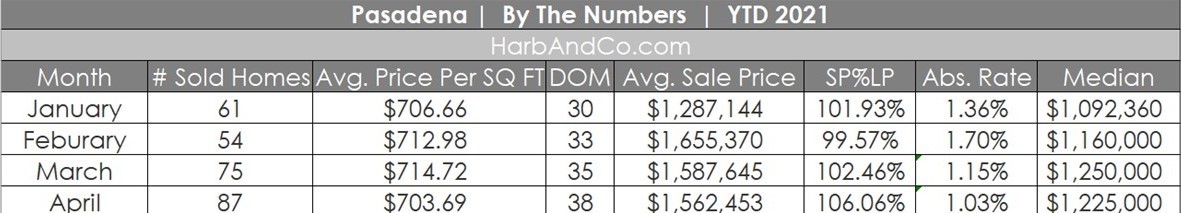
When examining the Pasadena housing stats, it’s interesting to note that the April 2021 absorption rate is the lowest year to date. The selling price to the list price is the highest year to date. The low inventory is heating the multiple offers and resulting in most homes selling for over their asking price.
And from one of my favorite blogs: Core Logic:
This month marks the 125th anniversary of the Dow Jones Industrial Average, a stock-value metric for 30 blue-chip U.S. companies. Very few assets have such a long valuation history, and fortunately, single-family housing is one such asset. Let’s compare how stock and home prices have fared over time to commemorate the quasquicentennial.
From the Dow’s inception in 1896 through 1946, the Dow and average home prices tended to move together, except during the Roaring ‘20s. Since 1946, stock market valuations have generally outpaced home price growth.
The stock market and home price trends reflect a risk and return tradeoff: assets with greater risk also offer the potential for greater return. Comparing the growth rate in the Dow, U.S. home prices, and the Consumer Price Index show that over long periods of time, the growth in the Dow has exceeded that of home prices, and home prices have outpaced inflation. However, the annual growth rate of the Dow has also been more volatile. The Dow has averaged at least two percentage points faster annual growth than U.S. home prices but with more than double the volatility.
Greater volatility is reflected in larger swings up and down in the Dow compared with average U.S. home prices. The upside potential is reflected in the faster overall growth in the Dow. We can calculate value change over, say, successive 10-year time frames since 1946 to illustrate the downside risk. Ten years happens to be the median tenure of homeowners during the last generation. If you owned stock for 10 consecutive years in the 30 companies that made up the Dow, based on the Dow’s experience since 1946 you have a 10.6% chance of experiencing a loss. In contrast, the odds that a U.S. home-price index would have fallen after 10 years is 1.5%.
Related Post: 1485 Lomita Drive Pasadena luxury sale


But, for a more severe problem, medication prescriptions can help cialis generic reviews